10 Lecture 4 Handouts
Exploratory data analysis and visualisation
10.1 Today’s session
- Exploratory data analysis
- EDA in R and Tableau
- Handling categorical data in Tableau
10.2 Today’s learning objectives
- Understand the role of exploratory data analysis
- Able to conduct exploratory data analysis in R and Tableau
- Able to work understand and use level of detail calculations.
10.3 Exploratory data analysis
10.3.1 Exploratory data analysis
Exploratory data analysis refers to performing initial investigations on data to discover patterns, spot anomalies or check assumptions
Methods used are often summary statistics and graphical representations
E.g. before starting your analysis, you may want to explore how many times certain events appear in your dataset; or how much variation there is withing a certain variable.
10.3.2 Exploratory data analysis
Steps to take:
Check data types of your variables (also part of the cleaning process)
Check for missing data (also part of the cleaning process)
Create summary statistics for relevant variables
Means, SDs, 95%CI, Median, etc
Frequencies
Correlation (if necessary)
Box-plots or Histograms
10.4 Exploratory data analysis in R and Tableau
10.4.1 Exploratory data analysis in R
- Make sure you can remember them
- If not use Semester 1 materials of B1700 and B1701 to practice
Most likely you would do the bulk of your exploratory analysis within R but you’ll notice Tableau may be slightly more efficient for quick visualisations
10.4.2 Exploratory data analysis in Tableau
Time for a demonstration
10.4.3 Questions?
10.5 Level of Detail Calculations
10.5.1 LOD calculations (1)
- LOD expression represent an elegant and powerful way to answer questions involving multiple levels of granularity in a single visualization
10.5.2 LOD calculations (2)
A key aspect of exploring data is understanding the structure of the source.
In Tableau, you typically do this by dropping the dimensions you care about into your view (e.g., team, year).
10.5.3 LOD calculations (3)
Adding more granular dimensions to the view will change your viz.
What if we do not want to change our vizualisation? That’s were LOD calculations come into play
10.5.4 LOD calculations (4)
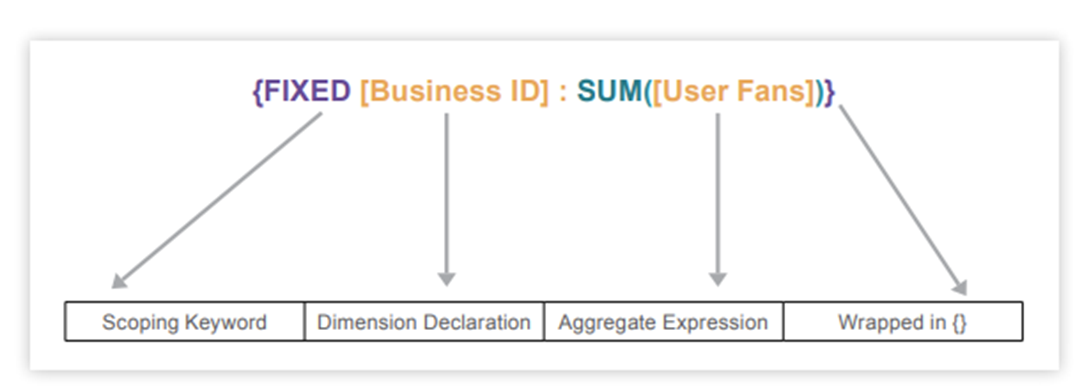
The expression tells Tableau to perform the aggregation for each Business ID, regardless of other dimensions used in the viz.
10.5.5 LODs in Tableau
Time for a demonstration
10.6 Back to learning objectives.
- Understand exploratory data analysis
- Assists in the initial investigations on data to discover patterns, spot anomalies or check assumptions
- Able to conduct exploratory data analysis in R and Tableau
- Are you familiar with the procedures?
- Able to understand and create an LOD calculation