6 Lecture 3 Handouts
Data visualisation in Sport
6.1 Today’s session
- Purpose of sports data visualisation
- Current data visualisation techniques
- Data types
- Recap data cleaning
- Data cleaning in Tableau
6.2 Today’s learning objectives
- Understand the role of sport data visualisation in competitive sport
- Understand the different types of data visualisations used
- Understand how data type impacts on sport data visualisations
- Recall data cleaning principles and procedures
- Able to conduct data cleaning procedures in R and Tableau
6.3 Purpose of sports data visualisation
6.3.1 Data categories
- Spatio-temporal information / tracking data
- Absolute spatio-temporal information
- Players or objects coordinates and time
- Relative spatio-temperal information
- Anything calculated from the players or objects coordinates and time (e.g. distance to goal, possession time)
- Absolute spatio-temporal information
- Statistical information / box-score data
- Event (e.g. server error)
- Athlete (% of completed passes)
- Meta-data
- Athlete characteristics, course/ pitch characteristics
6.3.2 Goals of data visualisation
- Goals of data visualisation depend on the audience
Who could be interested in the data visualisation?
6.3.3 Goals of data visualisation
- Feature presentation
- Feature comparison
- Feature prediction
6.3.4 Feature presentation
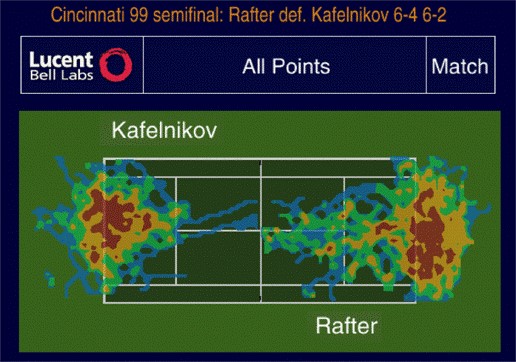
Presentation of trajectory information
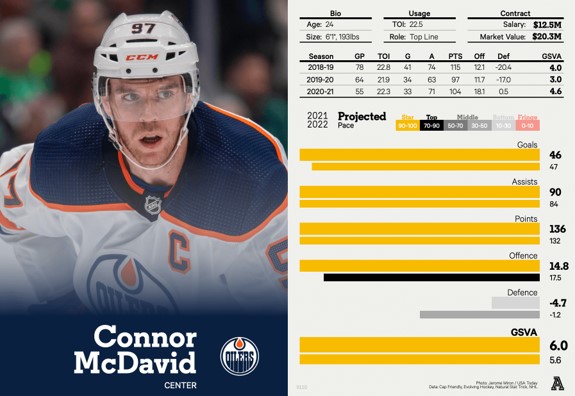
Presentation of players performance
6.3.5 Feature presentation
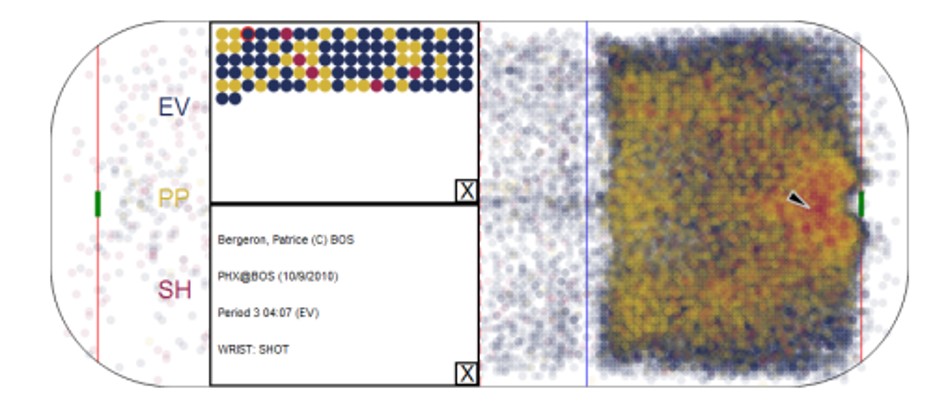
Presentation of special events
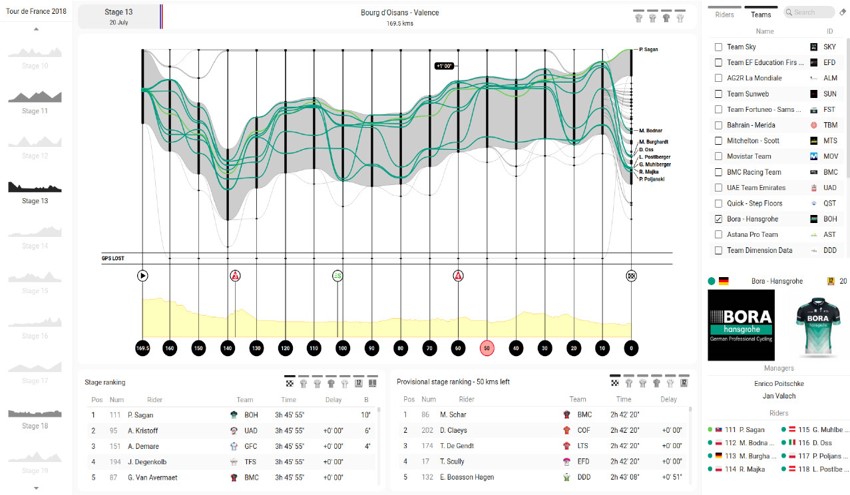
Presentation for game/race information
6.3.6 Feature comparison
Athlete comparison
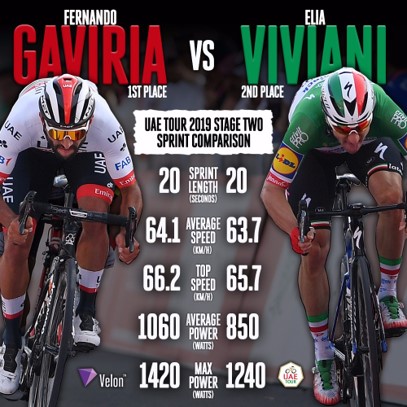
Game information comparison
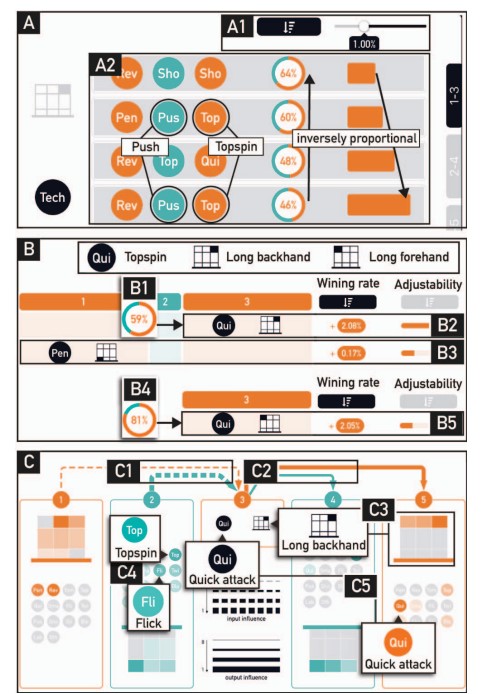
6.3.7 Feature prediction
Game results estimation
Game tactics decision making
6.3.8 Challenges in Sports Data Visualisation
- Data volume and complexity
- Integration of diverse data sources
- Ensuring accuracy and reliability
6.3.9 Questions?
6.4 Current data visualization techniques
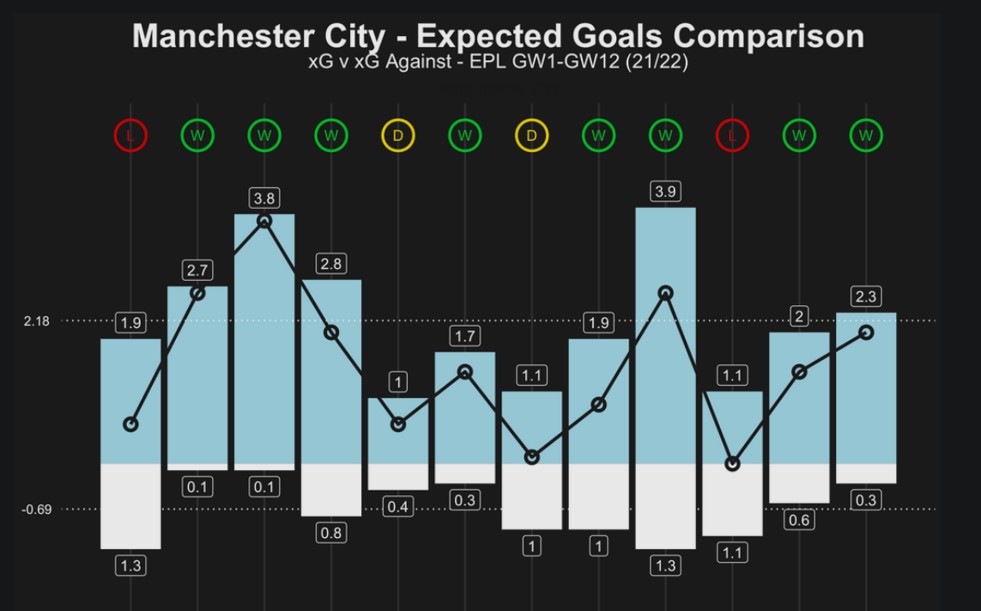
6.4.1 Basic data visualisation techniques
- Bar charts, line graphs, pie charts
- Basic statistics and metrics
6.4.2 Advanced data visualisation techniques
- Heatmaps for player movement analysis
- Radar charts for multi-dimensional performance metrics
6.4.3 Predictive analytics and machine learning
- Using algorithms to predict player performance
- Injury prediction models
- Decision trees
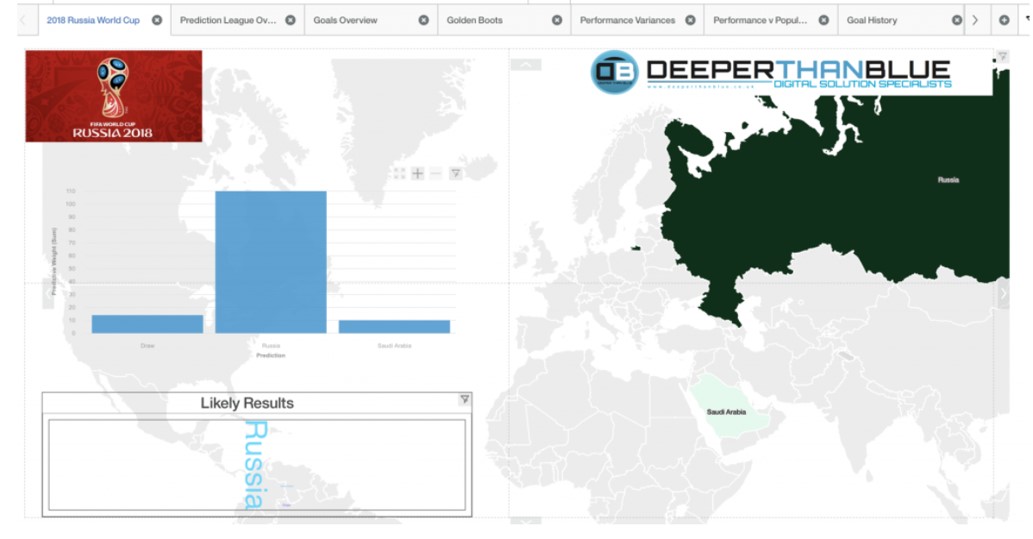
6.4.4 Interactive data visualisation
Fan-facing dashboards
Coach and player dashboards for in depth analysis
Scouting dashboards
6.4.5 Questions?
6.5 Data types
6.5.1 Data types
Can you remember which types of data we may be working with?
6.5.2 Data types
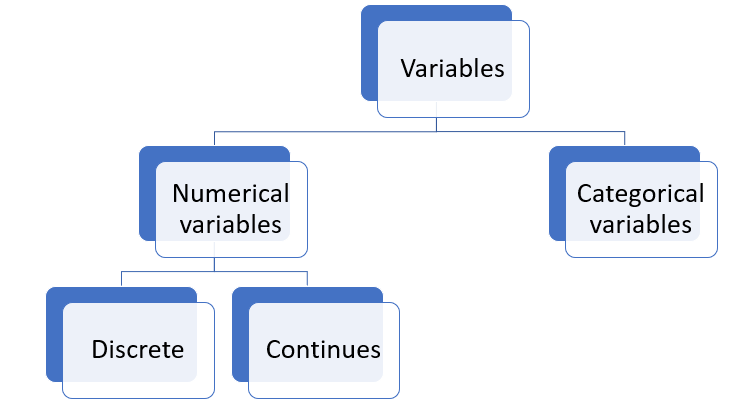
6.5.3 Data types
- Understanding the different types is important for further analysis
- Continues and discrete variables
- Measures of central tendency
- Categorical variables
- Frequencies
- Maybe mode
6.6 Data cleaning
6.6.1 Data cleaning steps
Can you recall the steps?
6.7 Data cleaning in R/ Tableau
6.7.1 Data cleaning steps in R
Make sure you can remember them If not use Semester 1 materials of B1700 and B1701 to practice
6.7.2 Data cleaning in Tableau (Prep)
Time for a demonstration
6.8 Back to the learning objectives
Understand the role of sport data visualisation in competitive sport
Fast way to conduct initial data exploration
More efficient way of sharing key findings
Understand the different types of data visualisations used
Basic: Line charts, bar graphs, scatter plots
Advanced: Heatmaps, tracking heatmaps, radar charts
Interactive: include interactive elements
Understand how data type impacts on sport data visualisations
- Type and category of data determines the best visualisation to use
Recall data cleaning principles and procedures
Think irrelevant data, duplicates, structural errors, missing data, outliers
Always validate your data at the end of the cleaning process
Able to conduct data cleaning procedures in R and Tableau
- Are you familiar with the procedures?